We were asked by a major call recording company to develop pivot reports for their clients call data. Pivot reports are a special class of business intelligence reports that use special data structures known as pivot tables.
Call recording tables record calls in a flat table. Each recording has over 30 metadata fields. The more important ones are the following
Date and time
Agent
ANI
DNIS
Call Duration
Agent Skill Set
Call Direction
Extension
Recording Channel
DialedDigits
The pivot report would enable a user to select the dataset using ranges for any of the above fields.
It would then allow a user to aggregate data over one or more fields. The aggregation function could be either count of the number of calls, average a value such as call duration, or sum values such as call duration.
Some of the questions, such reports could shed light on are –
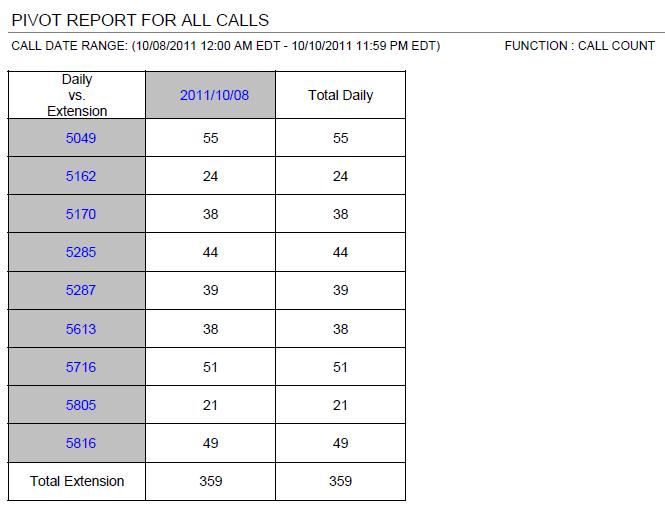
Daily Count of calls per agent or extension
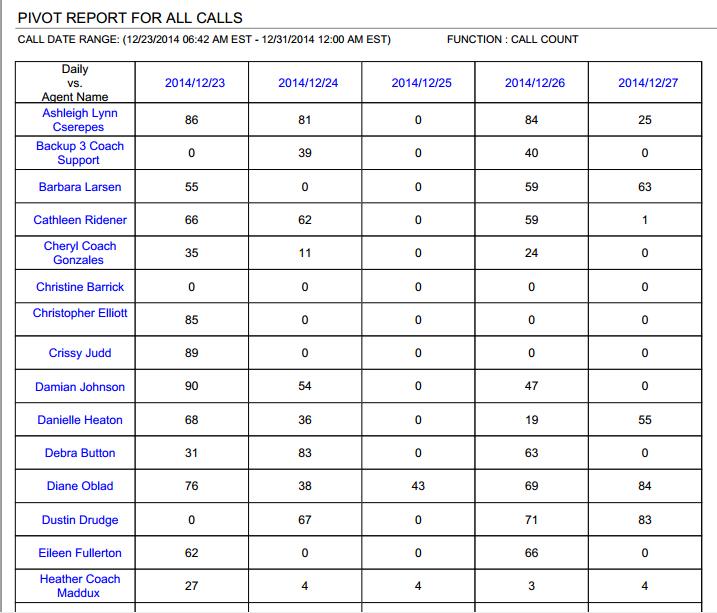
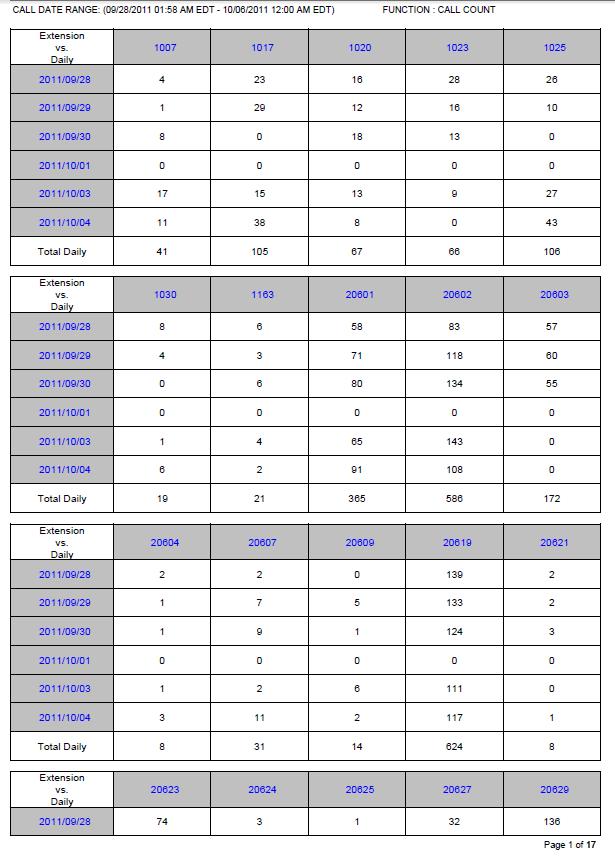
The above report with rows and columns swapped
Total Daily call duration agentwise
Daily count of calls by ANI, DNIS, Agent Skill Sets, Call Direction
Average daily call duration agentwise
A call center manager can easily see the advantages of such reports.
The aggregation can also be reported daily, weekly or monthly.


